Abstract
Introduction: Youth undergoing blood and marrow transplantation (BMT) experience significant distress. The widespread and mainstream use of mHealth technologies such as smartphone applications offer a unique opportunity to collect patient-generated health data that can enhance patients' and clinicians' understanding of symptom onset, trajectories, and inter-relationships. Network analysis (NA) is a useful tool that can illuminate inter-relationships between symptoms, leading to better collective understanding of the symptom experiences of these youths. This knowledge can lead to enhanced patient-caregiver interactions/collaborations, treatment management, and potentially support improved inference around adverse clinical outcomes.
Objective: To determine the feasibility of using network analysis to evaluate mHealth symptom data in patients undergoing BMT.
Aim 1. Estimate the network by creating a graphic model that depicts symptom inter-relationships.
Aim 2. Identify influential symptoms in the network by evaluating centrality indices and assessing the stability of edges and centrality results.
Methods: Study participants undergoing BMT recorded daily symptoms via a smartphone app from preconditioning through 120 days. Patients report their symptom experience (intensity and distress on a scale of 0-10). NA was conducted on the initial patients (n=3) to evaluate inter-relationships between reported symptoms. Each symptom is represented by a circle (node), while associations (regularized partial correlations coefficients) between symptoms are depicted as lines (edges). Stronger associations among symptoms present as thicker lines in the network and a higher value in the weighted matrix table.
Centrality indices identify and quantify symptoms that exert more influence in the network. These symptoms are influential in the network due to their strength (sum of absolute values of its connections with other nodes), betweenness (number of times a node lies on the shortest path between two other nodes), or closeness (the summed average distance of a node to all other nodes). Other centrality measures also exist. Centrality tests aimed to evaluate symptoms for their reported importance to the youth and association of those symptoms with other reported symptoms. The more "central" a symptom, the higher the potential to transmit effects to and from other symptoms in the network. This can make them important foci for intervention. Stability testing was used to assess the network's accuracy.
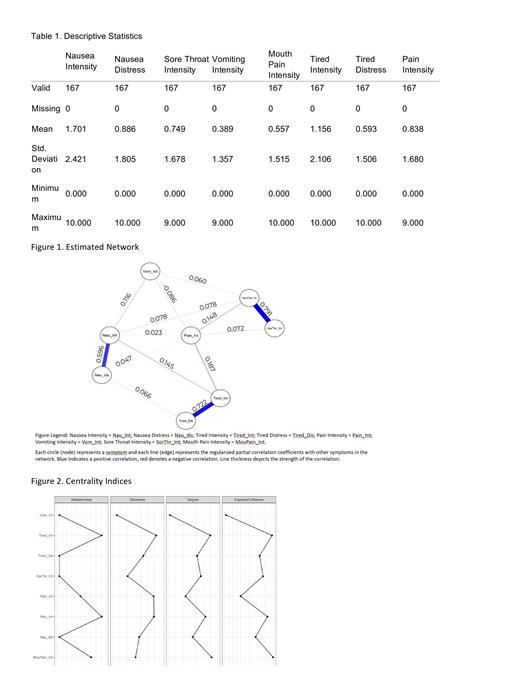
Results/Discussion: Descriptive statistics are summarized in Table 1. The estimated network (Fig. 1) provided details on the eight most often reported symptoms; nausea, tired (intensity and distress), vomiting, pain, mouth pain, and sore throat (intensity). The network shows strong mutual associations (regularized partial correlations) between the intensity and distress of nausea (.596) and being tired (.722). There was also a strong relationship between mouth pain and sore throat (.791). A less strong relationship was noted between nausea intensity and tired intensity (.145), and tired intensity and pain intensity (.187). A slight negative relationship was noted between vomiting intensity and pain intensity (-.086).
The centrality indices (Fig. 2) revealed vomiting intensity (-1.917) as the strongest symptom with the highest closeness (-1.715). The symptom with the highest betweenness centrality was equal for both nausea intensity and tired intensity at 1.286. To assess confidence in the network estimation we replicated this test 1000 times (non-parametric bootstrapping, n=1000) on the edge stability and centrality results (Fig. 3). Results indicate areas with wide confidence intervals (instability) especially in the edge between vomiting intensity and mouth pain.
Conclusion: It is feasible to use mHealth data from youth who experience symptom distress during BMT. However, efforts to obtain more data is necessary if we hope to make accurate inferences from the data. Future work will focus on enriching data collection, examining clinically important sign and symptom patterns and interrelationships, and to explore feasibility of using mHealth data for individualized/precision care and possible predictive uses.
Shah: Novartis: Research Funding, Speakers Bureau; GBT: Consultancy, Research Funding, Speakers Bureau; CSL Behring: Consultancy; Guidepoint Global: Consultancy; Alexion: Speakers Bureau; Bluebird Bio: Consultancy; Emmaus: Consultancy; GLG: Consultancy.


This feature is available to Subscribers Only
Sign In or Create an Account Close Modal